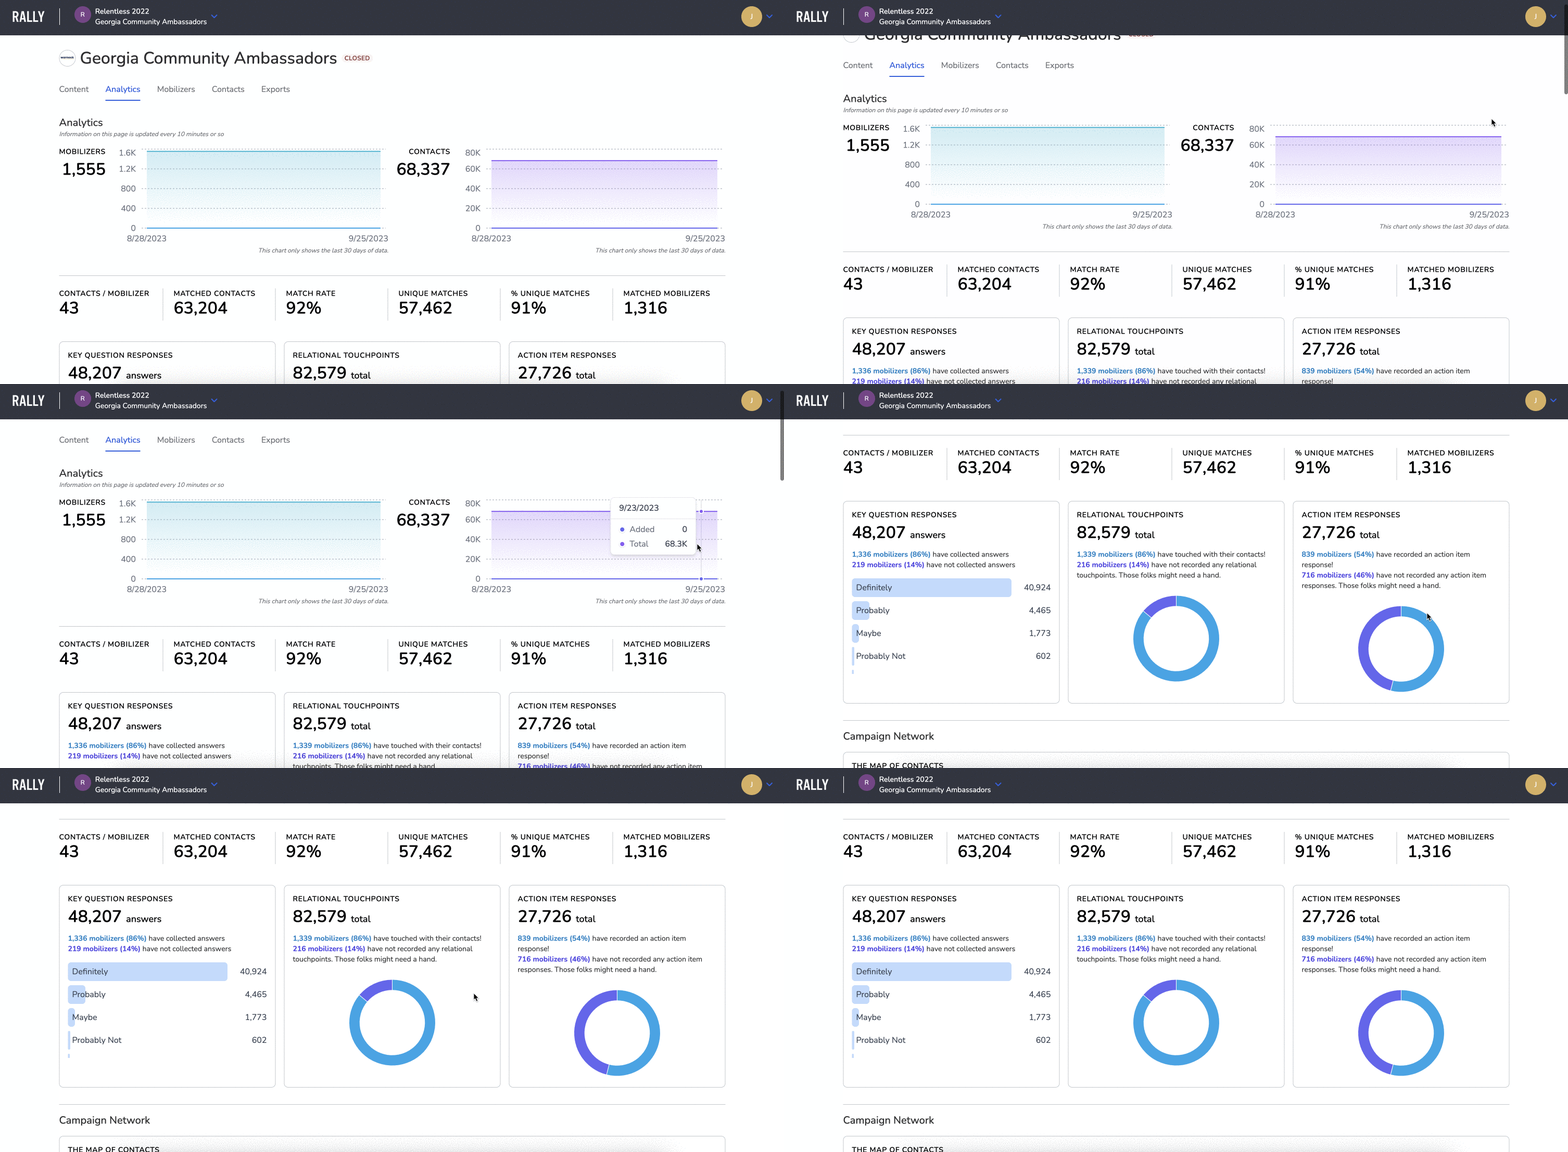
The Analytics page is designed to help you run your program as effectively as possible. It breaks down who your program is reaching, if it's working, and if you’re on track to hit your goals - ensuring you have the most actionable information at your fingertips.
<aside> 📊
The data you see in the analytics dashboard is updated every 10 minutes.
</aside>
<aside>
</aside>
The topline metrics show your campaign’s performance from the highest level. The table below provides definitions for each of these metrics.
| Metric | Definition |
|---|---|
| Mobilizers | The total number of Rally users who have joined your Campaign, accompanied by a line graph showing the total number of mobilizers (top line) and mobilizers added on a particular day (bottom line), for the last 30 days. |
| Contacts | The total number of contacts who have been added to your Campaign. This includes contacts who have been matched to the voter file, and those who haven’t. Also displayed is a line graph with the total number of contacts (top line) and contacts added on a particular day (bottom line), for the last 30 days. |
| Contacts / Mobilizer | The average number of contacts added per mobilizer. This includes both matched and unmatched contacts. |
| Matched Contacts | The total number of contacts who have been matched to the voter file. |
| Match Rate | The percentage of total contacts who have been matched to the voter file. |
| Unique Matches | The total number of unique contacts who have been matched to the voter file. |
| % Unique Matches | The percentage of unique contacts who have been matched to the voter file. |
| Matched Mobilizers | The total number of Mobilizers that are matched to the voter file. |
| Key Question Responses | A breakdown of Key Question responses including: |
| • Total number of Key Question responses | |
| • Count and percentage of mobilizers that have and have not recorded Key Question responses with at least one of their contacts | |
| • Count of each Key Question response option | |
| Relational Touchpoints | Relational touchpoints are defined as any relational action taken on a contact – including actions completed, notes recorded, and answers to the Key Question. The relational touchpoints breakdown shows: |
| • Total number of relational touches mobilizers in your Campaign have recorded with their contacts | |
| • Count and percentage of mobilizers that have and have not recorded a relational touch with at least one of their contacts | |
| Action Item Responses | Action activity within your Campaign. The action item responses breakdown shows: |
| • Total number of actions mobilizers in your Campaign have completed with their contacts | |
| • Count and percentage of mobilizers that have and have not completed an action with at least one of their contacts |
<aside> 💡
Some of the metrics displayed on the Analytics page are interactive, clicking on a metric may take you to a “New Contact View” or “New Mobilizer View” with the filters preset. You can then save the view, or change or delete filter criteria however you like.
</aside>

<aside>
</aside>
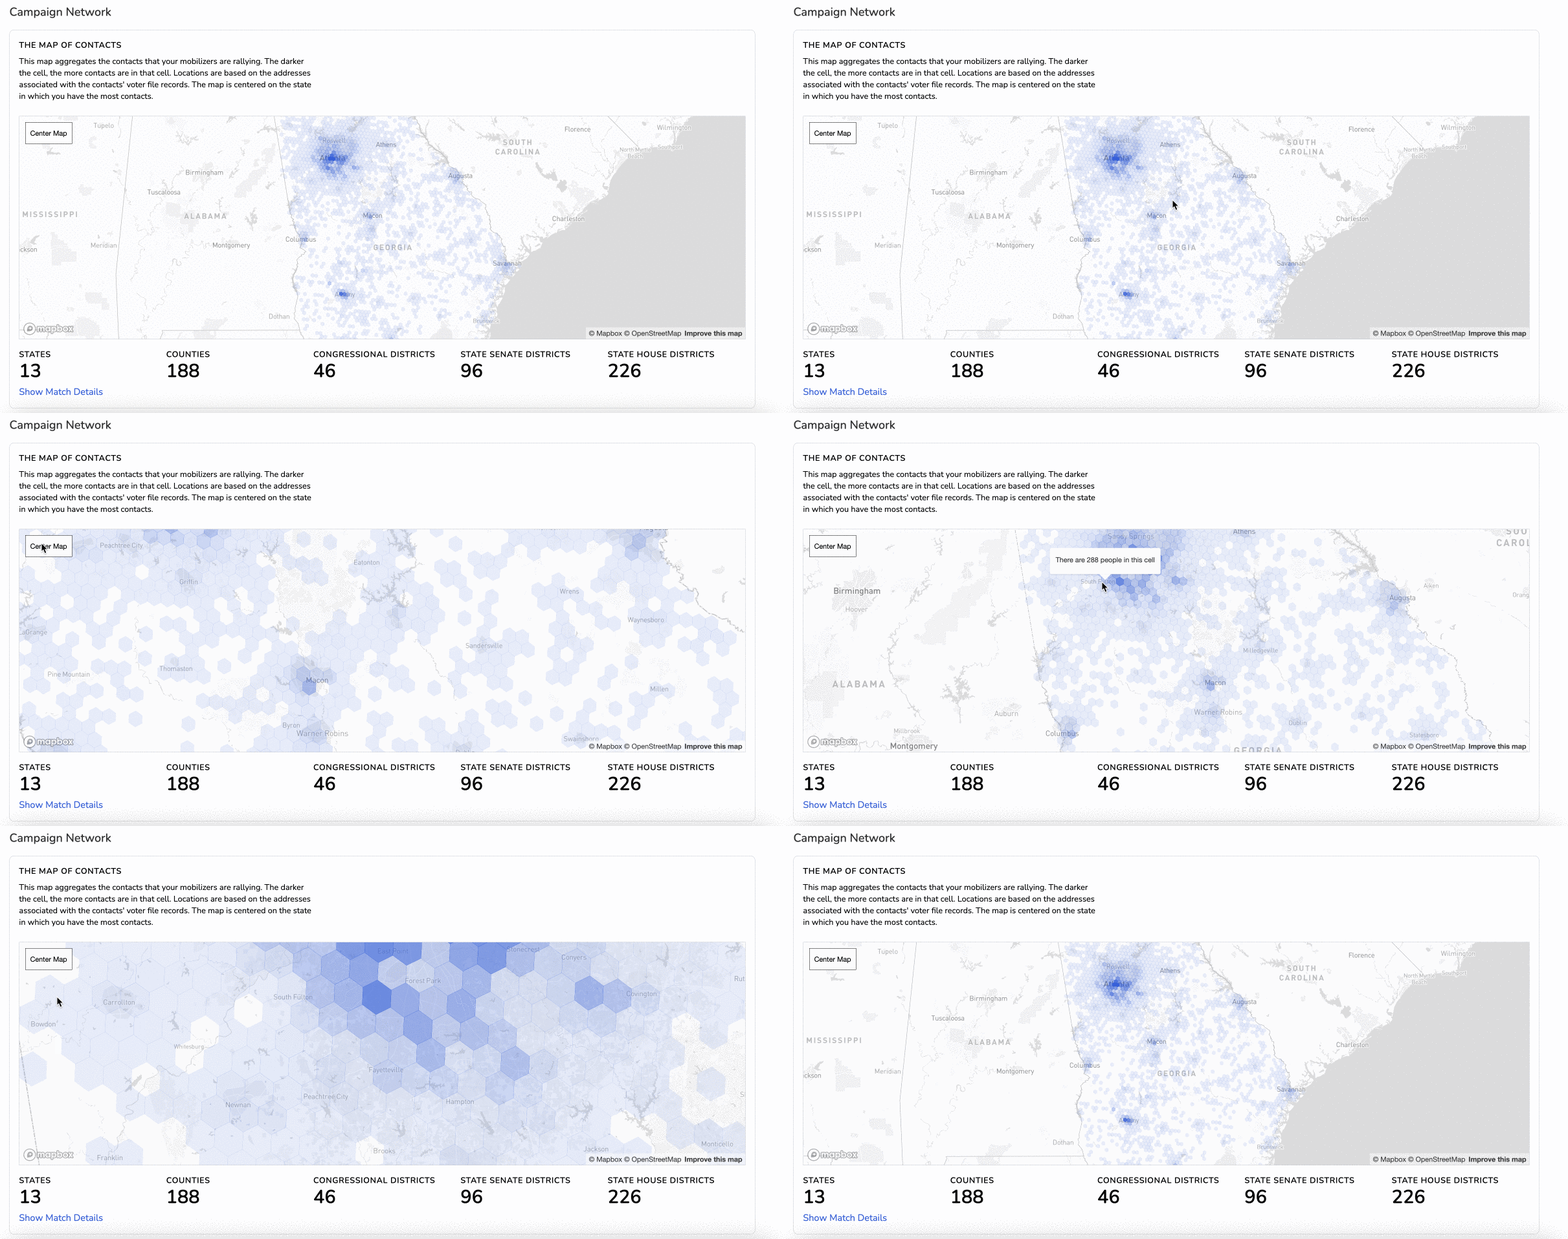
This section of the Analytics page provides an in depth, geographic look at your network of mobilizers and contacts through interactive maps and detailed demographics!
By hovering your cursor over the map you can:
-gif.gif)
<aside> 💡
You can re-center a map at any time by clicking on the “Center Map” button in the top left corner of the map.
</aside>
